Dispersion StainingThe first photograph below shows a glass sphere mounted in a refractive index liquid that matches the refractive index of the glass at a wavelength of 589 nanometers, the Fraunhofer Sodium D-Line. The mounted sphere is illuminated with monochromatic light of this wavelength. The edge of the sphere disappears because in has the same refractive index as the liquid at this wavelength. The internal structure of inclusions is readily apparent because these inclusions have a refractive index that is different than the glass they are in. 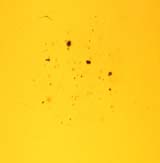 If white light is used rather than monochromatic light and the substage condenser iris is closed down then when the stage is lowered slightly colored Becke` Lines are evident. This is one form of dispersion stain that was first documented by O. Maschke in 1872 and was further developed by R. E. Wright in 1911. 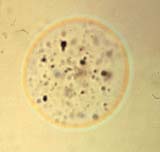
The two colors can be used to determine the wavelength at which the particle and the mounting medium match. The chart below illustrates the colors shown depending on the matching wavelength; in this case, 589 nm. 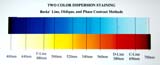
Light that is not refracted by an object on the stage of the microscope is not collected by the objective when darkfield illumination is used. The yellow-orange light of the Sodium D-Line is lost at the edge of the glass sphere but the wavelengths (colors) that made up the colored Becke` Lines are refracted and combine into one perceived color at the edge of the sphere. This is Darkfield dispersion staining. This was first documented by G. C. Crossmon in 1948. An advantage of this method is that the particle is in sharp focus when the colors are observed. 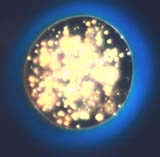
The single color seen here can also be used to determine the wavelength at which the particle and the mounting medium match. The chart below illustrates the colors shown depending on the matching wavelength; in this case, 589 nm. 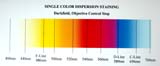
Phase contrast enhances the visibility of objects that shift the phase of the light traveling through them more than they refract the light. The phase effect is dependent upon the difference in refractive index. The sphere becomes colored with the complimentary colored halo as a result of the differences in dispersion for the glass and the liquid. This method of dispersion staining was first documented by G. C. Crossmon in 1949. 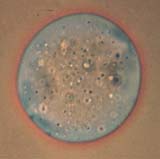
These are just three of the five different methods of dispersion staining. Click on the links below to see many more examples. Click here for more examples of Becke' Line Dispersion Staining Click here for more examples of Oblique Illumination Dispersion Staining Click here for more examples of Dark Field Dispersion Staining Click here for more examples of Objective Stop Dispersion Staining Click here for more examples of Phase Contrast Dispersion Staining |
